
Spectral Unmixing
The crosstalk issue
Today a wide variety of fluorescent dyes and fluorescent proteins are available for multicolor fluorescence imaging. Recorded signals from these fluorescent molecules provide complex information about multilabeled samples, often necessitating quantification or localization/co-localization analysis.
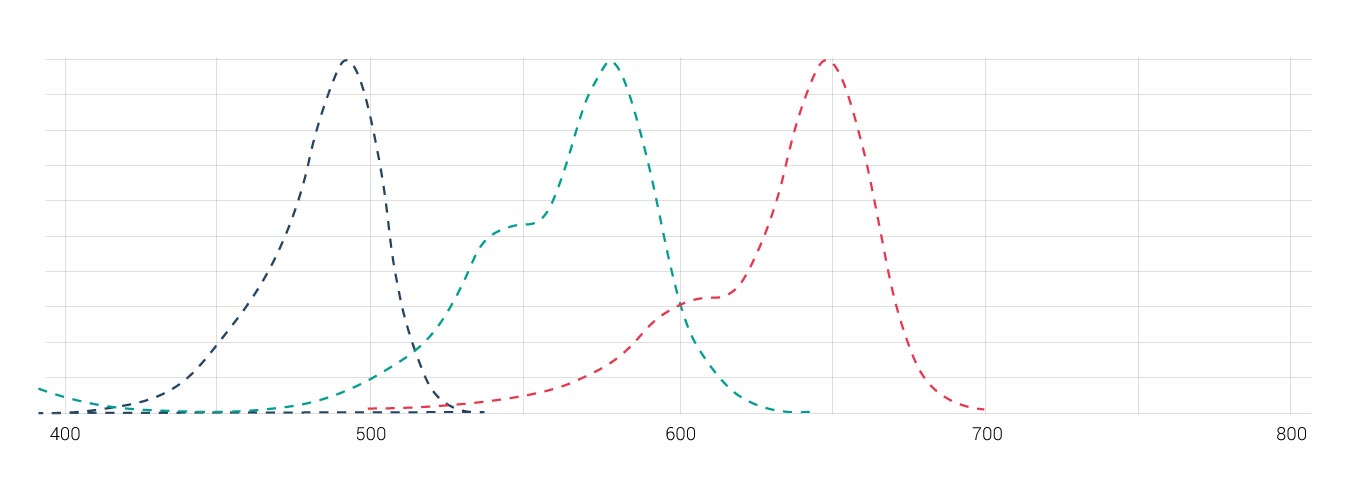
If significant overlap of the excitation or emission spectra of multiple fluorophores occurs it becomes difficult to distinguish between the different signals. Consider a combination of the three fluorophores Alexa 488, Alexa 568 and Alexa 647 (see Fig. 1). It is difficult to separate emission signals from these dyes due to their strong spectral overlap, which results in signals from multiple dyes in each channel. This phenomenon is termed crosstalk, or bleed-through. Interpreting multicolor images can be challenging in this case because they arise from a mixture of signals from multiple dyes.™
There are different options to avoid and/or remove crosstalk of fluorophores for multi-labeled samples. One way is to optimize the detection range to avoid crosstalk. Reducing the excitation light for each respective fluorophore will also reduce the emission intensity, which in turn reduces the degree of crosstalk. But, if the degree of overlap is too strong (Cy2/Cy3 for instance), a mathematical restoration of dyes into separate channels may be necessary.
Dyes separation
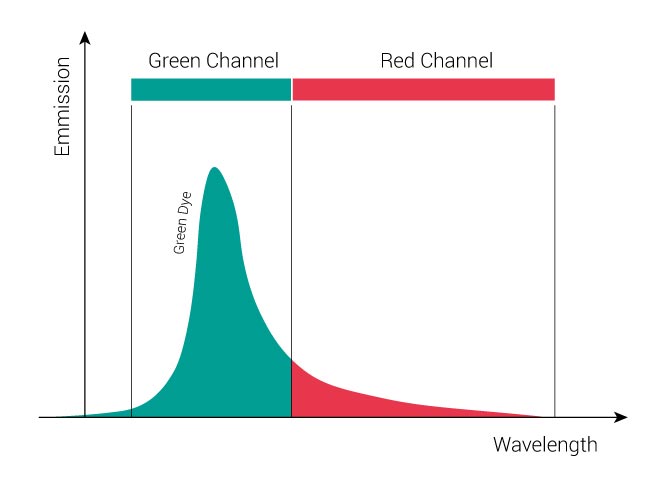
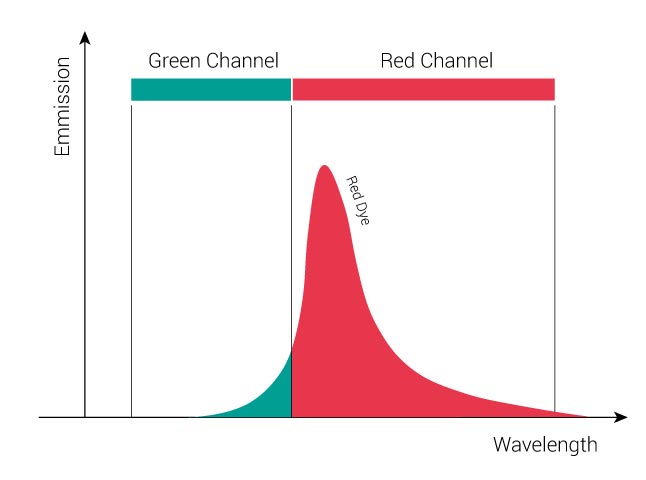
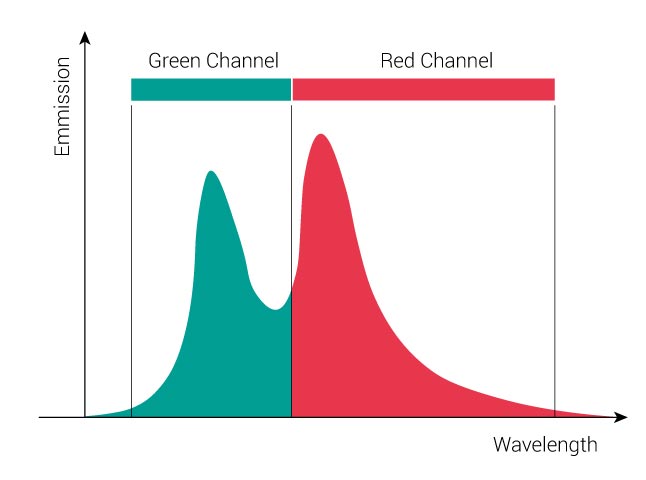
The following figure displays the individual emission spectrum of a “Green” dye and of “Red” dye. For the “Green” dye, the green channel collects about 3/4 of the entire green signal while 1/4 of the signal spills over into the red channel. For the “Red” dye, the red channel collects about 4/5 of the entire red signal while 1/5 of the signal goes into the green channel.
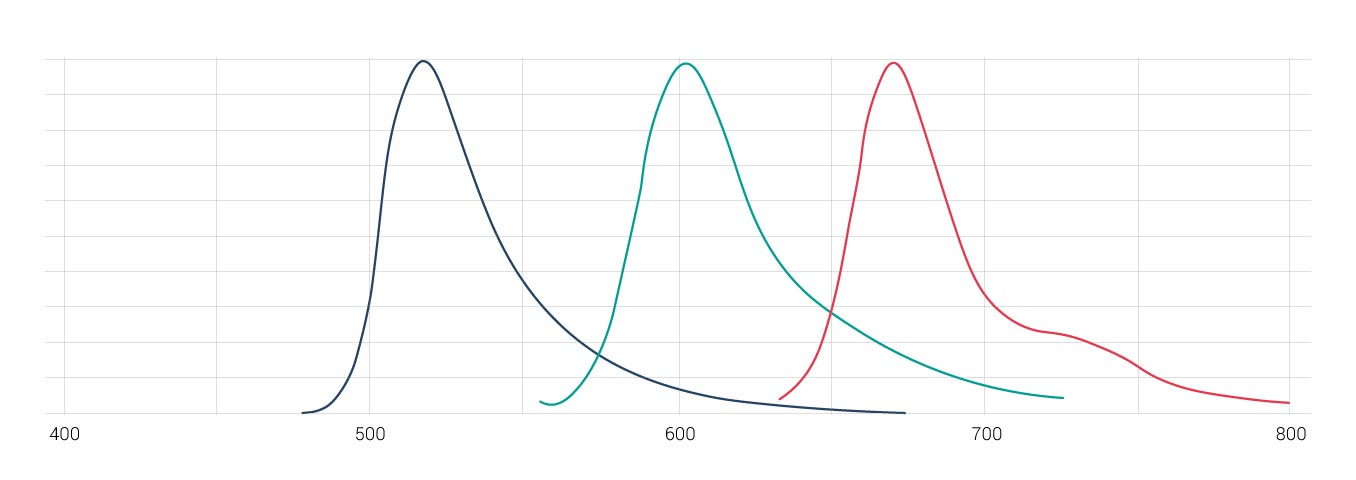
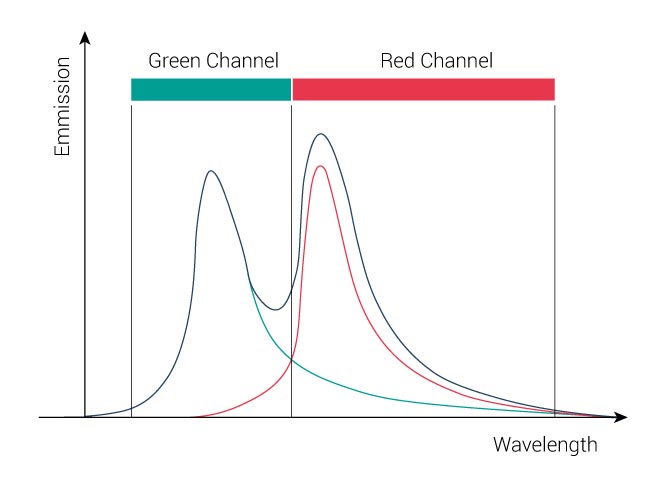
In a double-stained sample, signals from both dyes will be present. In our example you will record 3/4 “Green” dye + 1/5 “Red” dye in the green channel and 1/4 “Green” dye + 4/5 “Red” dye in the red channel. The following figure displays the emission signals of a double-labeled sample. The black curve represents the sum of the signals of both fluorophores.
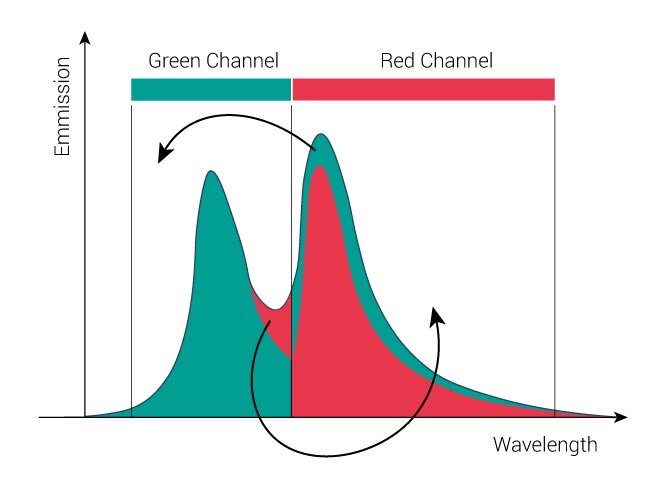
In order to remove the crosstalk, we need to separate the dyes as followed:
- 1/4 of all “Green” dye emission has to be removed from red channel
- 1/5 of all “Red” dye emission has to be removed from green channel
The objective of the mathematical dye separation is to separate the signals, so that each channel contains only the signal from one dye. This means that 1/5 of the “Red” dye signal has to be removed from the green channel, and 1/4 of the “Green” dye signal has to be removed and redistributed from the red channel. The resulting image will be free of crosstalk.
Spectral unmixing in mathematical terms
The Spectral Unmixing method was initially developed for processing multiband satellite images.
In general the algorithm is based on the following assumption: the total emission signal S of every channel λ is expressed as a linear combination of the contributing dyes FluoX. Ax represents the amount of contribution by a specific fluorophore. This method uses spectral signatures (emission spectra) as references. In the case of multi-florescence images, even combined and mixed emission signals can be clearly separated into the dyes that contribute to the total signal. In other words, the system calculates the distribution coeffi cients of all the dyes in the different
Channels:
S(λ) = A1 x Fluo1(λ) + A2 x Fluo2(λ) + A3 x Fluo3(λ)…
For correct unmixing it is necessary to find regions with pure dyes in the sample as references. The best way to do this is to use controls that contain only one of the dyes. This approach reduces the risk of taking spectra with slight contributions of other fluorophores as references. However, multi-labeled samples may also be used if there are areas within the sample that clearly contain single dye regions without co-localization. The distribution coefficients will be measured, and the sample can be analyzed. If you need to separate n different dyes, it is sufficient to collect n different channels; no ‘spectrum’ must be recorded.
The Fusion Spectra tool uses a mathematical procedure, called cluster analysis, for classifying objects into homogenous groups. In our case the objects being classified are the grey values of the pixels, which are acquired in different detection channels. After identifying clusters of homogeneous image data, the best-fit line is determined. Crosstalk correction is achieved by ‘moving’ the fitted clouds to the axes. The advantage of this method is that no spectral information is needed – the main distributions are found by fitting.
After the unmixing option has been selected, the spectral unmixing calculations are performed completely internally by the program. The program outputs a series of images containing the pure light for each dye present in the image. Furthermore, the conditional value of the spectral matrix is returned to quantitatively assess the error of the experiment.
Results
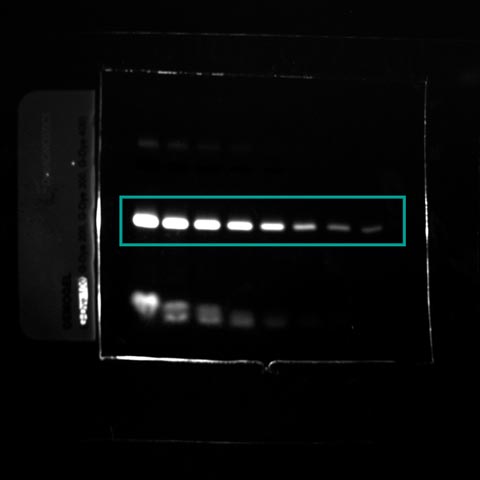
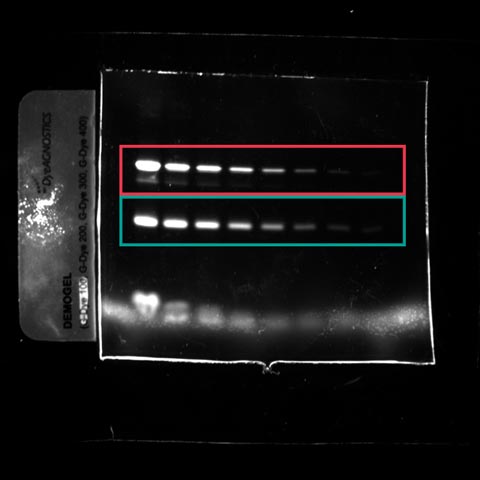
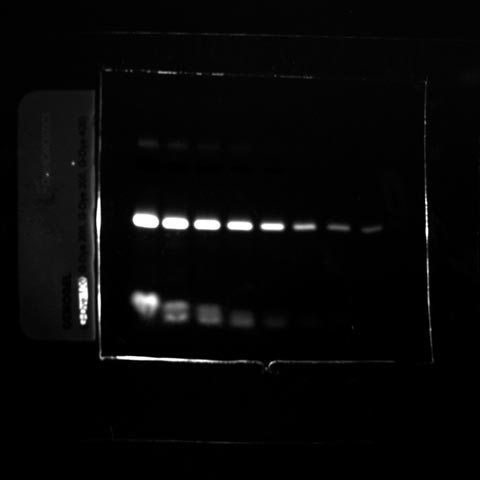
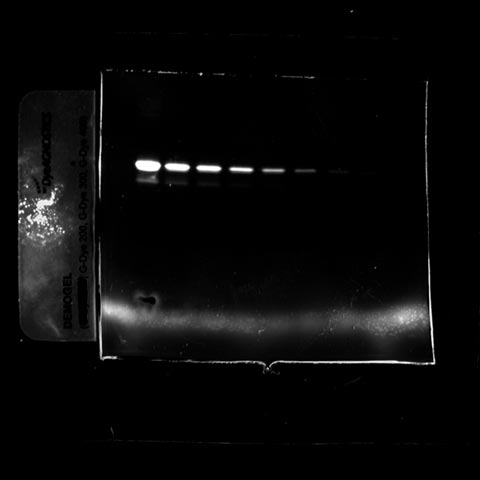
Fluorescent images were acquired using a Fusion Spectra IR system. The image sample contains the following dyes:
- The Gdye G300 in the near infrared channel
- The Gdye G400 in the infrared channel


